[following was published in SumZero]
Abstract
According to
Robert Prechter, a crisis will take on the characteristics of the one before the previous crisis. In order to entertain this line of reasoning we look past the inflation crisis of the 1970s and the boom of the postwar period, to the deflationary crisis of the 1930s. Both periods (2008-current, 1929-1946) were marked by concomitant endemic deflationary and artificial (policy-driven) inflationary pressures. A comparison integrating the following variables will show that policy decisions and real outcomes are similar to the 1930s: GDP (inflation adjusted), total outstanding credit (public, private and household), inflation (CPI, T break-evens, etc.) and interest rates (market and policy determined). As debt has been borrowed and denominated in USDs the long US government bond will benefit from capital appreciation and currency strengthening due to further deleveraging. A short-term target (6-12 months) for US 30-YR (USGG30YR) is set at 4.1% (as of writing, it is 4.55%)
Broad Parallels: Total Credit, Policy Rates and the
Yield Curve
Not only is total credit outstanding several magnitudes above the previous period, but the current period's policy rate environment is standard deviations more severe -- compare zero-bound policies today to +150bp in the 1930s. Traditionally expressed through the Treasury's short end, this policy mechanism broke down in 2008; QE was initiated thereafter -- longer-dated Treasuries and paper were purchased as a greater elastic measure to depress long rates and to liquefy credit markets, respectively.
Yield curve dynamics in the current US environment is similar to the Japanese deflationary experience (1990-current) and the previous US depression in the 1930s-40s.
The Japanese yield curve for nearly
the past two decades has been consistently normal (upward sloping) and steep; while concurrently facing massive deflationary
headwinds (despite counter-cyclical policies). The only exception was the the summer of 1987 to the winter of 1991 when the Japanese yield curve was inverted. Since early 1992 the curve has been upward sloping and steep with yields falling in nearly every duration. In the
U.S., in the early 1930s, also after a brief period of inversion, the yield curve became upward sloping, quickly steepened and yields dropped progressively in nearly every duration. On the long end, yields on the long-term 30-year US
Government bond (and high grade equivalents) drove lower until 1946 or 47. In terms of nominal/real rates, 1926-1927 was the cross-over point, with real rates rising above nominal, and did not cross back over until 1937/38. These dynamics describe a 'bull steepener', which is bullish for bonds, and bearish for
equities and risk-assets. A bull
steepener is typical of depression/deleveraging cycle. Recently, the yield curve's dynamics fit the
above bull steepener profile. The general trend is a depression in
yield across all maturities, while the curve steepens. The short-end is policy;
the long-end, deflation.
Comparable Policies
The outstanding difference in policy in
terms of rates is that the zero bound has been approached more rapidly in this period
versus the previous period. In the previous cycle of bust
following credit excess, policy rates were lowered in relatively gradual
fashion compared to the current period. Tracking the rediscount rate of the
Federal Reserve Bank of New York, beginning in 1914, 1920 marked the highest
average annual rate of 6.48%. At the year of the stock market crash, 1929, the
year's highest rate was 6.0%. By the following year, the average annual rate
collapsed to 3.0%. But it was not until 1938 for the rate to average the
absolute bottom of 1.0%. In the intervening period, rates fluctuated between
3.5 and 1.5. Compare to the near immediate response of reducing the same
discount rate to 0.50% (since February 2010, the rate has been 0.75%) and the fed
fund's rate to 0.25, in the current cycle; the FOMC settled on the zero bound
on both measures as soon as December 2008, or within the same quarter as the
severest portion of the market crash. (see chart)
 |
Fed Rediscount Rate, 1920-1945 [Credit: ACP Capital Advisors, LLC]
|
Though the current combinations of measures are
unprecedented, the question is if the speed of policy response and consistency
of zero-bound policy coupled with longer maturity purchases of debt and paper
(quantitative easing) cause a difference in outcome. It is worth pointing out that though the response in the 30s was slower, less consistent and less
drastic, the collapse in rate was 91% to the eventual lower bound (1.5% of
1.0%, from 6.0%) within two years (1931); policy, therefore, was not as delayed
as generally perceived. One can argue whether a 1.0% target relative to the
current 0.50% would have made a difference, but considering the credit market
debt increase in the previous periods respectively, it is hard to imagine
that a 50bps difference would have ignited appetite. The following evidence
will demonstrate that current policy measures pursue the same string
pushing regime with respect to further credit creation.
Policy Efficacy
In addition, fed policy makers and observers
alike have noted the decline in the past quarter century in the effectiveness
of policy tools in shaping longer term rates. In terms of manipulation of short
maturity rates in order to shape the yield curve, the relationship has changed
dramatically since the late 1980s, according to Daniel Thornton of the St.
Louis Fed. Thornton hypothesizes that the marked change in the relationship is
due to the FOMC switching from using the funds rate as an operating instrument
to using the funds rate to implement monetary policy.
If the Fed's standard monetary policy tool has
been losing its effectiveness, controlling money's velocity may be out of
policy's hands, save for an experiment called QE. In fact quantitative easing
may be the Fed's only recourse to contain rates and prevent a deflationary
spiral and a collapse in broad economic activity. The same unconventional
methods also place the economy closer to the risk of hyper-inflation from the direct monetization of debt -- as they are the only remaining walls separating the
economy from uncontrolled deflation. Having in recent memory the inflationary
crises of the 1970s, senior managers remain fixated on the latter outcome. Money velocity trends and broad debt accumulative patterns paint a different picture.
Underlying Dynamics
Structural dynamics underlying the economy have not changed. Cycles of
credit/debt expansion and destruction are unavoidable; resulting in boom periods
(1950s/1976[currency float]-2000) and subsequent deleveragings (2000-[postponement period; 'Greenspan put']-2008-current). Note that though the
initial crash began in 1929, the Great Depression did not begin officially
until 1932, or three years afterwards – in terms of aggregate output and
unemployment. A similar outline of events may be unfolding, with some
non-minor differences.
|
|
Total Nonrevolving Credit Outstanding YOY %Change [Credit: St. Louis Fed]
(Shaded regions indicate recession)
[note: violation of zero-bound] |
With respect to credit expansion as a percentage of GDP
prior to the crash (see total credit figures) fiscal and monetary tools used in
the 30s were similarly accommodative as the current period. Chairman Bernanke dropped policy rates at a breathtaking clip as early as 2007 from
525bps to 25-0bps, and initiated the unconventional debt purchases, but given
the relative explosion in credit relative to GDP, the measures taken seem much
less out of proportion to the previous period. A zero-bound interest rate
policy, plus QE and other expansive fiscal policies, may be approximately as accommodative
as the low-mid single-digit policy of the 1930s, though not in absolute terms.
Fiscal and regulatory policies will likely
continue to mirror the 1930s, when government intervention prevented market
forces to resume organic growth, despite low rates and deficit spending. Cole/Ohanian's study of wholesale government
intervention and its adverse affects on wages and prices in the 30s is a
troubling reminder that applies today. Where in the 30s the emphasis was on a
policy-induced artificial differential in prices in labor and industry, the
current crisis' emphasis is on the differential in paper and real estate assets
on corporate and household balance sheets. Market pricing mechanisms are being
retarded by bad policy; the effect on the real economy may be as distortionary
as in the 30s.
Comparable Data
Some absolute figures are as disconcerting as
those seen in the 1930s and comparable with respect to their
counter-inflationary implications.
With consumer spending in the U.S. accounting
for over 70% of GDP and a current real unemployment rate (U6)
of 16.7% (and over 20% if using pre-Clinton era BLS metrics), the depression in
real wages will figure onerously against the rising threat of policy induced
inflation. Just like the 30s when rates were eased and fiscal policies were
expanded, endemic deflationary considerations did not allow monetary and fiscal
policies to achieve their aim. Signs of a repeat of history, like the collapse
in the M1 multiplier (keeping money velocity in the system low) are evidence of
such endemic deflationary concerns despite counter-cyclical policies.
Since the crash in late 2008, the credit transmission
mechanism has broken down; the credit created at the Fed, through asset
purchases, emergency loans (Bloomberg, LP has sued the Fed for disclosure) and longer-end Treasury purchases, is
failing to reach the broad economy. Excess reserves of deposit taking
institutions have gone parabolic. Add to this, the deflationary effect of
private sector unemployment is further compounded by the imminent reduction in
public sector employment, which constitutes a considerable 12% of U.S. GDP,
given the $125+ billion deficit facing local and state governments.
|
|
Excess Reserves of Depository Institutions "Perfectly parabolic" [credit: St. Louis Fed] |
|
|
Federal Reserve Balance Sheet (Total Assets) 8/07-12/11
|
|
|
|
(Shaded regions indicate recession)
|
And the fact that average wages figure so
prominently in the economy is not helped by the observation that all of the
debt has already been created (mostly via securitized instruments in this
cycle). Though before the crash, debt creation was accelerated by
unprecedented leverage fueled by artificially low rates, % change credit
figures (see charts) show that the increase in monetary infusions and direct
asset purchases by public monetary and fiscal entities are replacing (not
creating) the huge sums of notional value actively being eroded during the
deleveraging/depression process. At least $12 trillion has been already written
down, out of the $60+ trillion in outstanding debt (global GDP is $58
trillion), not counting the additional trillions that need to be written down
if covers and sensible mark to market accounting rules had not been introduced
and suspended, respectively. In any case, these numbers are staggering in contrast
to the low single digit trillion QE figures.
Bridgewater Associates' Ray Dalio** likes to
emphasize the long and drawn-out nature of deleveraging/depressionary cycles,
which are also characterized by rolling waves of secular and intermittent
countertrend market movements. The counter-cyclical policies are attempting to
at least allow an overwhelming tide of debt outstanding from being too rapidly
expired. Total non-revolving and revolving credit outstanding have been
declining and declining at a high rate. It is unclear if Fed and Treasury
policies are achieving their intended result of keeping markets liquid and
stable. Market participant reactions have been worryingly inconsistent with
past stimulative counter-cyclical policies.
Inflation Metrics / Concerns
Currently, the five-year five-year forward
breakeven rate sits at 2.97%, with a short term high of 3.28%. While
five-year TIPS - five-year Treasuries = 2.31%. As recently as October,
core CPI had its lowest year-over-year print since 1958, when records
began. The Commerce Department's PCE index excluding food and energy rose
0.8% year-over-year in January after increasing 0.7% in December for the
smallest advance since 1959, when records began (source: Bloomberg). Although core CPI and PCE
weigh housing prominently (49% for CPI), its significance to consumer spending
and output cannot be understated in a post-2001 credit bubble environment, when
housing overtook equities as the main driver for individual net worth. In
terms of their pass-through effect, the exclusion of food and energy costs in
these metrics, though seemingly disconnected with the public, has been
essentially non-existent for decades (source: Reinhart/Bloomberg).
These inflation expectation meters, though
higher since the depths of the current downturn, are still signaling stronger
signs of disinflation, and potential deflation, than outright inflation.
Keeping in mind QEI's completion and QEII's (over) halfway execution, resulting in over two years of nearly uninterrupted currency
creation; in light of these prints, perhaps it is more worrisome that
even with the debasing tendency of the Fed's QE policies inflation has failed to be meaningfully produced.
|
|
Trimmed Mean Inflation Index (Dallas Fed) [credit: Dallas Fed, Bloomberg]
|
|
|
Total Revolving Credit Outstanding (Billions of USD) [Credit: St. Louis Fed]
(Shaded regions indicate recession)
[note: uninterrupted positive first derivative and subsequent negative reversal]
|
Post-bubble Debt Appetite
Following a mass credit expansion, market
participants (excluding policy makers) are reluctant to bear debt all over
again -- at least not right away. If history is a guide, they will act reversely and logically delever their respective balance sheets;
government fiscal/monetary stimulus notwithstanding. None of this is helped by
the fact that the pre-2008 credit expansion was the largest in recorded human
history (due to poor arbitrary monetary policies and controls, current account
imbalances, fiscal profligacy and relaxed accounting standards for corporates
and sovereigns). At this point in the debt cycle and rate of monetary expansion, attempts at
policy-induced credit expansion will continue to 'push on a string.'
To conclude that all further policy action will
result in immediate and inexorable calamity in the direction of the most
extreme perceived outcome for a given course of action, simply because of
failed monetary policy leading up to the recent turmoil, is not the result of
clear-headed thinking. Short-sighted extrapolations can lead to problems
not unlike the pre-bust era case of underlying home prices and future
valuations of CDOs-- when only post-war data was used in predictive models,
which reflected nearly consistent positive first derivative prints.
In the U.S., overwhelming consensus of
economists, forecasters and buy/sell-side analysts and many portfolio managers
is that deflation is no longer the primary risk, and many others believe
inflation is imminent on a relatively short-term basis. Comparisons to
Japan style deflationary malaise are generally rejected, citing U.S. savings
tendencies and significant foreign ownership of U.S. debt.
Economists forecast by Bloomberg (Bloomberg,
L.P.) show overwhelming votes for relatively high-moderate inflation (see
figure). They have been shown to be consistently wrong (overshooting
significantly) in the previous two years, compared to revised figures.
However, despite their lack of success, revisions have been minimal.
Their expectations remain high for inflation.
Future QE Considerations
Consensus irregardless, considering the change
in total credit and inflation expectation figures, the Fed will continue and
finish QEII as planned, despite a lack of unanimity within, and will most likely
announce QEIII and QEIV, largely shadowing policy decisions of Japan's BOJ for
nearly two decades. This intention has already been signaled to the
market as soon as Bernanke/FOMC decided to undertake Quantitative Easing (the arguments for a zero-interest-rate-policy
trap are convincing). The net effect on inflation will remain muted if
not negative, or deflationary. A first hand observer of the policy
reactions of the BOJ to the credit bubble implosion shares the
same view.
|
|
DJIA Sep. 1929-July 1932 [credit: Elliot Wave International]
[note: initial decline -49%, subsequent rally +52%, and crash ~-85% (from top)] |
|
|
Consumer Loans (blue) and Commercial/Industrial Loans (orange) [credit: Fed]
|
The Federal Reserve (whose shareholders include publicly traded banks) though not a traditional
profit-seeking entity, shares a characteristic in common with the banks that
they are mandated to regulate. The Fed has strong incentive to keep its
monetary and employment mandate, and guarantee that its
practicing institutions remain in tact; they will not act to destroy the
currency and effectively go out of business – unless under truly extraordinary
circumstances. The Fed will only resort to
hyper-inflationary policies out of sheer last resort in order to avert a
deflationary crisis that is multiple standard deviations more severe, measured
in total debt contraction. The pace of debt destruction must be more
comparable to the total debt outstanding. This means printing some
multiple of GDP greater than 0.75-1. In all other scenarios, the Fed will
tread the line carefully, as it could spell its own end along with the currency.
As the Fed continues to provide excess
liquidity surplus credit is clearly failing to penetrate an
iron curtain of excess reserves held at the Fed. In addition to loss reserves
related to a rising number of NPLs, the availability of credit-worthy entities
is causing these reserves to build up without entering the broader economy. In
addition, the previous buildup of debt on balance sheets of both corporate and
household borrowers is causing appetite to wane. If minimal loss reserve
requirements are raised, or if another correction precipitated by a fall in
asset prices wipes out large chunks of equity in banks, excess reserves may
very well have to be increased further -- which, in turn, will further restrict
credit to the economy.
|
|
Government Debt / Revenue (2010)
Government Interest Expense / Revenue (2010)
[Credit: Moody's, Hayman Capital Management, L.P., JMF]
[note: Despite large debt (top), U.S. benefit: w/ low relative rates and high revenue - (bottom)]
|
|
|
Dollar Index Spot (DXY) (2006-2010)
[note: rally in '08-'09 (orange) and subsequent higher lows (red)]
|
Endemic Deflation
Given these concerns, deflation is the current
greatest probable risk to market stability. The base case remains to be
the overlooked explanation: the inflation, which the majority is expecting, has
already occurred. The previous multi-decade decline in the major trade weighted
dollar, despite the Fed's devaluation, continues to mark higher lows and
lurches upward during broad-market sell-offs. Technically, based on five-year
view, a case can be made for a base-building process in the USD. Weaker trading
partners may accelerate the strong/stabilizing dollar trend. Keynesian
Endpoint discussions become urgent with the Eurozone and Japanese sovereign
debt concerns. A comparison of Revenue/Interest Expense
ratios of both peripheral and some core -- France and Spain -- Eurozone states
and Japan, to the U.S. illustrates the disparity. As the least worst
case, the USD stands to gain in purchasing power intermediately in synergistic
conjunction with the deflationary pressures of debt repayment.
|
|
Gold price (2007-2011)
[note: sell-off in '08-'09 highlighted in orange]
|
Though in the background, there is a systematic
currency devaluation to help manage the debt load. The relative strong
performance in the price of gold and other precious/monetary metals is a
corroborating factor. The undercurrent of destabilization of major
currency pairs has been a theme tracing back to 1971, but recent aggressive
monetary policies exacerbated the problem (policy rates veritably mirror a
roller coaster in the past two decades). Gold's strength in the face of
competitive devaluative policies is no surprise. But as the liquidation
that occurred in 2008-09 illustrates, such being the nature of deflationary
cycles, even the considerations of inflation via gold's price were swept to the
side as the price of gold lost nearly 30% of its value in a matter of
weeks. The current retail euphoria does not help its
short-term-intermediate case; it is susceptible to a non-minor correction.
The best performing sovereign debt in the past
decade has been JGBs. The failure of market participants to discriminate
between real and nominal yields/returns has been behind many failures to
successfully short this asset. In nominal terms, 10-year JGBs have
recently yielded just above 1%. In real terms (real return), with the
strengthening Yen, due to their endemic deflation, the yield is several
hundreds of basis points above the nominal rate. Given the real yield, Japanese
patriotism and high savings rates alone are not the cause for nominal yields
staying low. Having experienced the same, the Japanese are increasing their UST
overweight.
Jeffrey Gundlach**** relates the tug-of-war between endemic
deflationary and artificial inflationary forces to a, "a room with a
heater and humidifier both running at the same time." As long as one is
running at full force, the other, if also running strong, will counter-balance
the effect to some degree. As soon as one is turned off, the humidity, or
lack thereof, will certainly be unbearable. The Federal Reserve will
likely continue QE and its forthcoming iterations, and not cease until natural
inflation is produced -- in the U.S., that means real and sustainable employment
growth.
Employment
This excludes intermediate tampering by the BLS
with the unemployment calculation from pressure by the Administration, as was
done recently (inflating the denominator in unemployment rate
calculations). Considering the current trend of the growing long-term
unemployed, which recently reached new levels -- where the average duration of
unemployment is now longer than the length of standard unemployment benefits
(source: bloomberg) -- the single most important
determinant of inflation seems ever distant to recover.
Interestingly however, given his track record
for accurate foresight -- [paraphrased] "The subprime problem will be
largely contained, and its risk, in scope to the rest of the mortgage market
and economy, limited" (Bernanke, 2007), Chairman Bernanke, in his latest
FOMC speech, described the risk of deflation going forward as,
"negligible." Again, if history is a guide, considering the
state of employment and credit growth, this statement could be interpreted as
an inverse indicator.
|
|
Recommendation
In the face of large fiscal deficits brought
about by war, transfer payments and stimulative policies, the 1930s (till past
mid 1940s) were characterized by yields on the long end that continued ever
lower, as yields at all maturities rode a general decline. The decline in short
maturities can be explained by concerns of protection of principal and a
general lack of liquidity in a deflationary environment. The concurrent steady
decline in long maturities can be explained by investors' appetite for yield
amid an environment of low growth and inflation. To the benefit of the current
long bond, if inflation continues to print lower and growth expectations resume
a downward trend, yield curve dynamics may mirror the prior deflationary
example.
As pointed out by Irving Fisher, the dollar's value, or purchasing
power, will rise during deflationary times. The U.S. dollar stands to
benefit in intermediate phases of deleveraging, as already seen in
2008-09. Given that the vast majority of outstanding debt globally has
been issued and therefore denominated in USDs, the resulting deleveraging (or
paying back of the debt) will create a demand for the currency that is in
proportion to the unnerving rate of growth of debt during the pre-2008 period.
Crises of liquidity denominated in this currency will continue. To meet
debt obligations, risk-assets will sell off, including equities, commodities,
and investment-grade/high yield corporate and municipal/local GO's.
Discrimination between high and low qualities
within any particular risk-asset class will prove, as seen in 2008-09, to be
largely immaterial. Cross-asset class correlations go to 1.0.
Because of their safe-haven status, long-term U.S. Government bonds will stand
to benefit. Given low inflation or deflation, they should return a relatively
high realized compound yield versus low inflation. More aggressive short term
traders will seek the capital appreciation benefits of zero-coupon and
discounted (off-the-run) U.S. Treasury bonds. In a period of debt deflation,
markets become liquidity-driven; individual asset fundamentals are a distant
secondary concern.
Along with inflation and a return to pre-crisis
growth rates, the market will weigh the risk involved with a long bond issued
by a government that is running record fiscal and current account deficits.
Given the record US Federal budget deficits, and the unavoidably large unfunded
liabilities, a $113 Trillion worth ($1.13E14), or 909% of U.S. GDP, it is
reasonable to assume that the first sign of weakness in markets from a
perceived lack of confidence in the future value of the security will
precipitate a wave of selling in Treasuries. However, as always, the
question is in the timing. The forgone conclusion of many participants is that
it will be within months or a few short years. These participants overlook that
officials will very likely place further temporary covers and/or guarantees
while compromises are made on the future liabilities, thus staving off a
sell-off in Treasuries for at least several more years, despite these deficits
and imbalances.
Moreover, a 10-year yield above 4% (and 30-year
above 5%) will be deflationary with respect to burden on total interest
expense, and rates will not rise further. Recent UST30YR trading behavior does
not confirm a bearish scenario; there is a persistent bid at key technical
levels. As total credit outstanding is still multiple standard deviations above
the mean, Treasuries will rally intermediately as the dollar strengthens from
further deleveraging. Total deleveraging, at least, will take several more
years. Because of the fluid situation, however, we advocate an abbreviated time
frame of 6-12 months; 30-years seem over-sold within the current range (2.5-4.75%).
As debt as been borrowed and denominated in
USDs, the long US government bond will benefit from capital appreciation
and currency strengthening due to further deleveraging. A short-term
target (6-12 months) for US 30-YR (USGG30YR) is set at 4.1% (as of writing, it
is 4.55%).
--
Appendix:
|
|
|
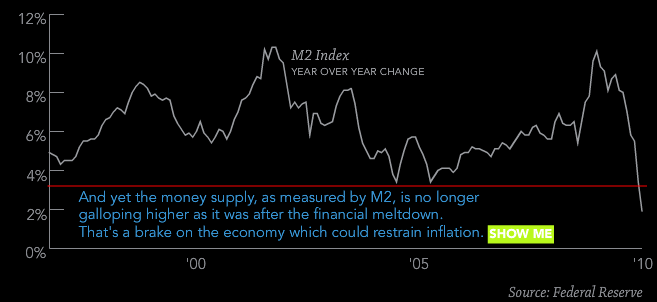
M2 Index YOY% Change [Credit: Fed]
|
|
|
Commodity Index, Reuters Jefferies CRB [credit: Bloomberg]
|
--
*Title in homage to the original article written by
Eichengreen/O'Rourke
**Ray Dalio is President/CIO and founder of
Bridgewater Associates, the world's largest hedge fund, managing over $80 billion. They specialize in currency/interest rate overlay strategies.
***Mr. Gundlach was a runner-up for Morningstar's Fixed-Income Fund Manger of the Decade.